
SIPOC: How to improve processes in a few steps?
If your goal is to improve a process, the first thing you must do is understand it. To do this, you need to get the information, define the step by...
6 min read
A few months ago, near my house, a family decided to start a business and use part of their garage as a bakery. They put up a display case, had their ovens, a nice sign, and all the attitude to make their new business grow. One day I decided to buy. I sampled the products with my afternoon coffee; the bread had a good texture, a soft crumb, was salty enough, and tasted good overall.
The following week I rebought it, but it was not the same experience this time. The texture was fine, but it was saltier than usual. The same thing the following weeks; the taste was not the same, the texture varied, and sometimes, the cooking time was longer than desired.
What was going wrong? It was clear, the lack of standardization in the process.
"What you can't measure, you can't control."
Standardization and continuous improvement are usually the answers to offer customers a good experience.
For this reason, I will explain a work philosophy that seeks standardization and reduction of variations, along with a continuous improvement methodology and support tools that will facilitate the process.
Index
Lean Six Sigma
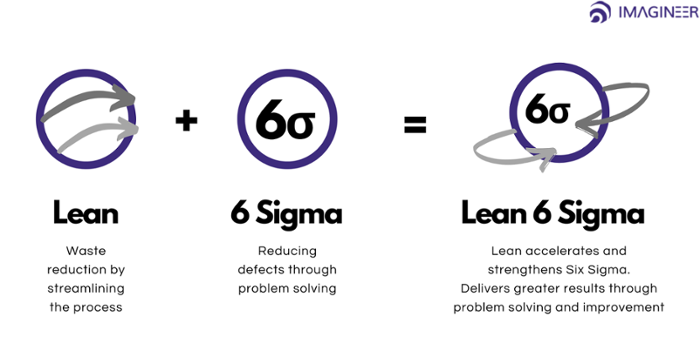
Lean Six Sigma is a work methodology that adopts two highly effective philosophies and merges them, taking the basic principles of each one to be applied in the processes.
To expand on the previous statement, Lean is a management philosophy based on the "Toyota Production System" work methodology, which seeks to avoid any waste in your production by consuming the least amount of resources possible, such as time, energy, and effort, through the elimination of process variations and activities that have no added value.
Six Sigma is also a work philosophy that works as a tool to control and reduce variations. From a strategic point of view, it is a discipline that adapts manufacturing and service processes to a low tolerance for waste and irregularities.
In a summary, the following image explains how these philosophies complement each other to work in harmony.
DMAIC methodology
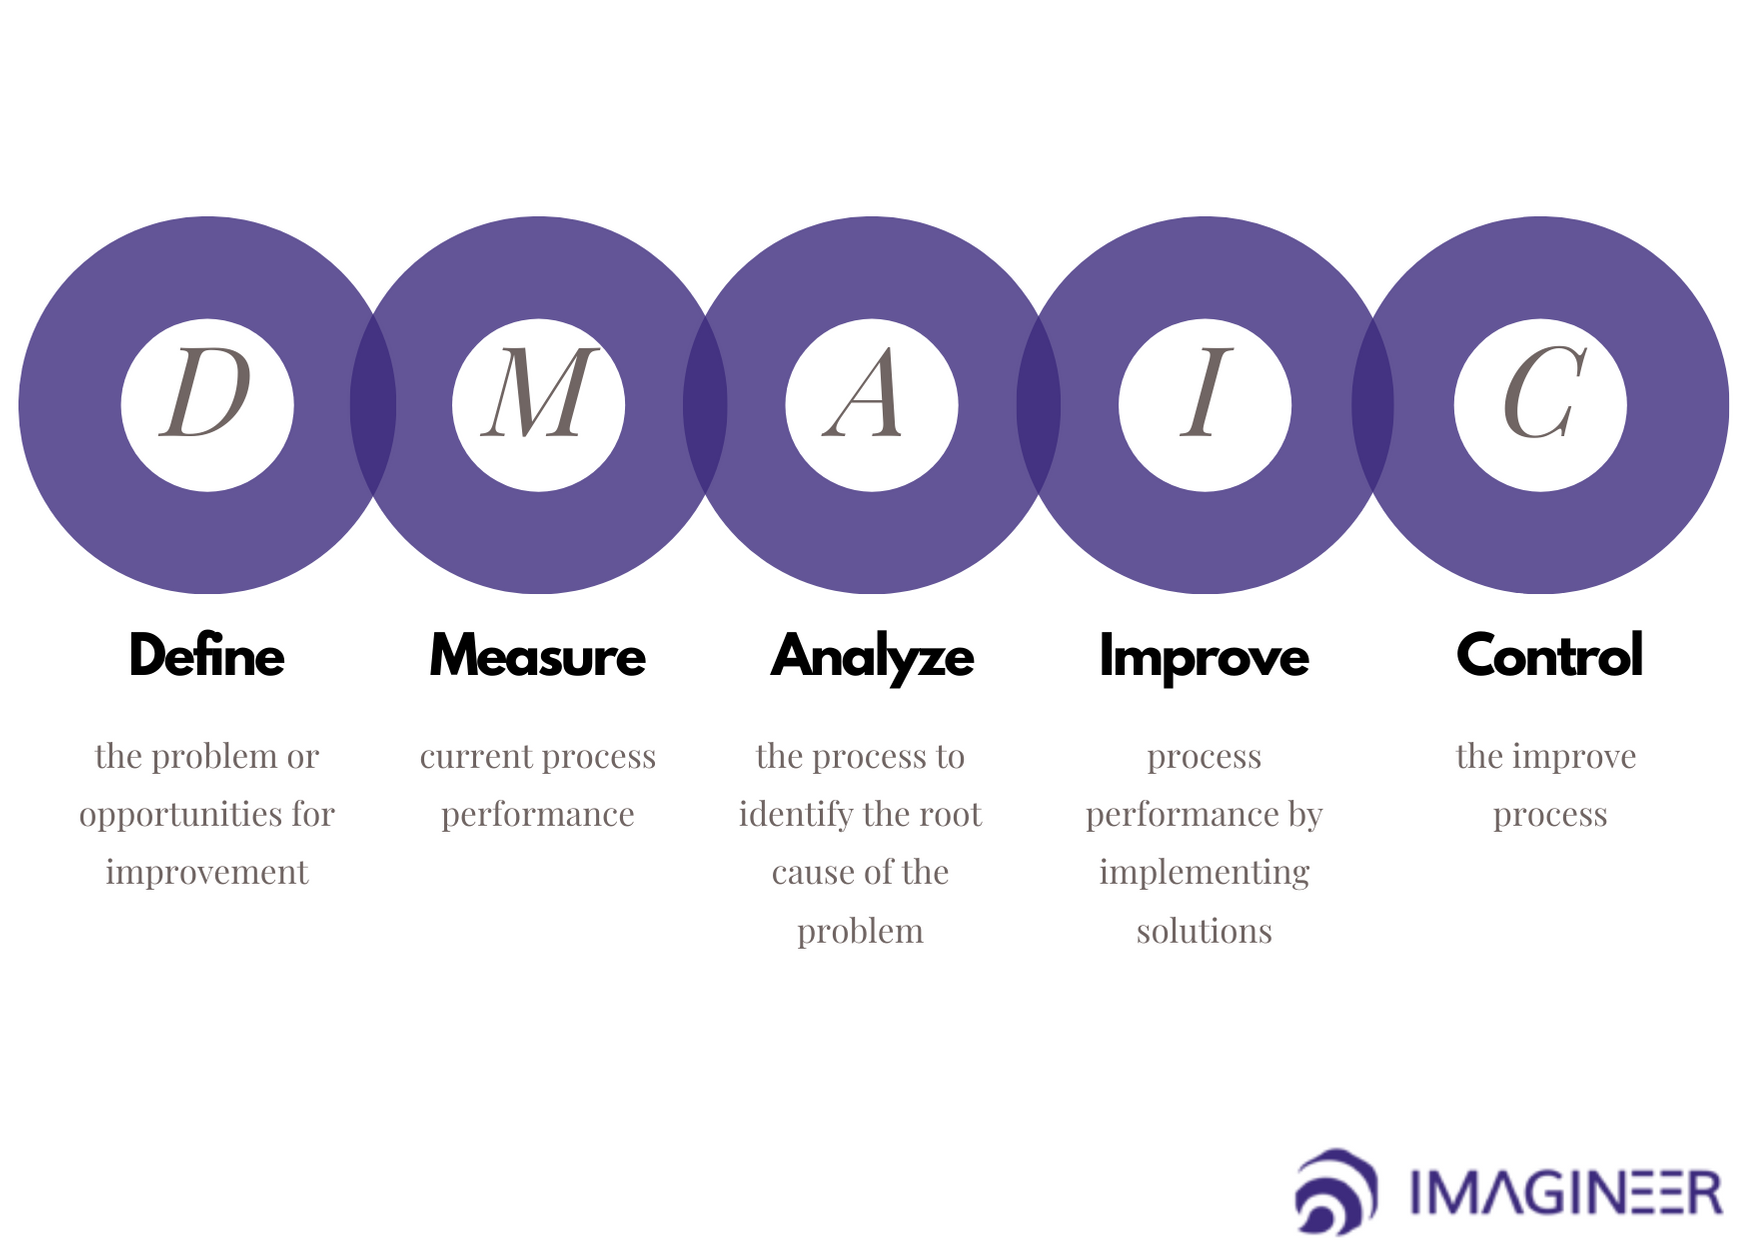
DMAIC is a continuous improvement methodology consisting of 5 phases: Define, Measure, Analyze, Improve, and Control, and is included within the tools of the Six Sigma philosophy. Each stage is designed to follow a logical sequence in the search for continuous improvement in a given process.
If you want to learn more about standardization, Six Sigma, DMAIC, and customer experience, I invite you to read the following blog: Improve your Customer Journey Map with Six Sigma. Although focused on a specific tool (Customer Journey), you will find interesting information about DMAIC and its importance.
Back to the topic, I will stop in the "Define" phase for a moment. Sometimes this stage is considered unimportant because it is not as practical as the others, and, for some people, it does not reflect its contribution to continuous improvement. But, the truth is that this stage lays the foundation for the rest of the project. In "define," you must identify all the variables involved, more importantly, do it correctly, as this information will be used as a guide. If the problem is not clear from the beginning, how do you intend to solve it?
For this reason, I will give you some tips to define the process and make a proper information gathering. If you want to read more about the definition stage in a project, I leave you the following blog:
DMAIC Methodology: Define stage.
Process diagramming
Before the diagramming, you should define the team in charge. Ideally, you should have a group of people from different disciplines so that the contributions are more enriching and with varied paradigms. You should explain to this multidisciplinary group the importance of the project, the methodology under which they will work, the reporting format, and others. Also, it would be ideal to establish periodic meetings to review progress.
Once you have determined the process that the team will study, create a list of the activities that comprise it, requirements, procedures, internal and external clients, and all the data that you think is important. You can use the SIPOC tool for this information gathering, which I will explain later.
In addition, you can do Gemba walks and interviews or questionnaires to those in charge of the activities to better understand the process.
Once the information is collected, you can summarize it in a flowchart to visually and understandably present to anyone.
What I am describing is for an As-Is process, i.e., the current one, as it is done today. Moving forward in the DMAIC phases, you will find that you must analyze this previously defined process to identify improvements and turn it into a To-Be process, that is, a future process, with the implemented changes.
Next, I will explain some of the Lean Six Sigma tools applicable to the phases of the DMAIC methodology.
Lean Six Sigma tools
In the following image, I show you a list of tools to use for each of the stages of the methodology, some are part of the Lean Six Sigma philosophy, and others are not; however, you can use all of them to analyze processes.
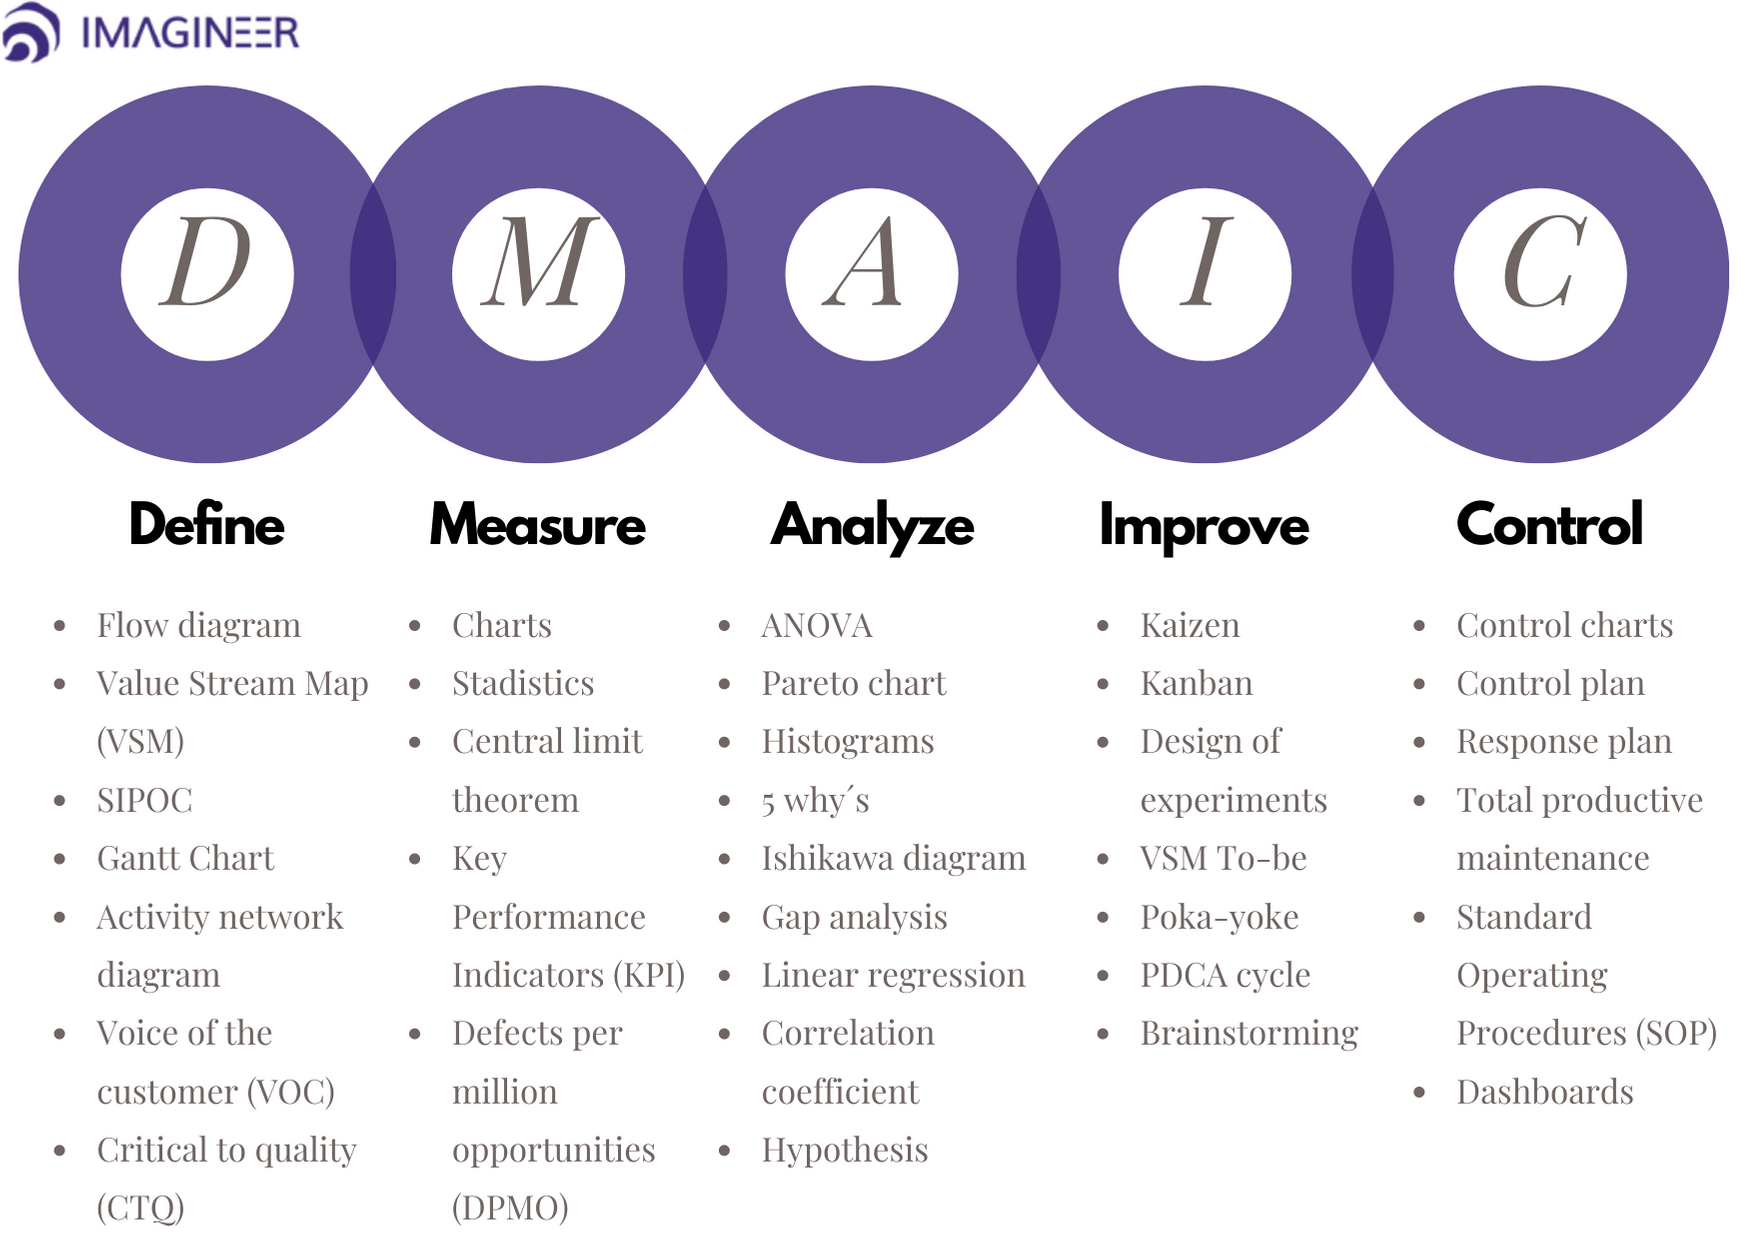
From this totality of tools, I will put four under the magnifying glass and give you a more extensive explanation of their application.
A flowchart is a graphical representation of the process and its constituent activities, which gives a broad view of the process. This tool facilitates the definition stage and allows the analysis of activities that do not add value to the process.
For its construction, it is necessary to be clear about the process to be diagrammed, the level of detail (how general or specific the flowchart will be), and delimit the boundaries (where the process starts and ends), the sequence of activities and the bifurcations that may arise.
The graphic representation is given using symbols, depending on the selected standard, the symbology may vary a little, but in general, the following signs are used:
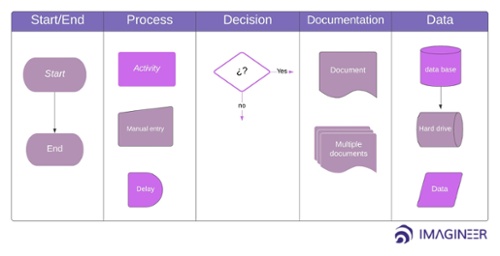
There are more, but their application will depend on the characteristics of the process; in general, the most used are start/end, activity, and decision. These symbols can be arranged in a linear flow, sectorial (mainly if the process covers several departments), by assembly, or in a physical arrangement.
You can find online software that will help you with the tool's design, such as Lucidchart.
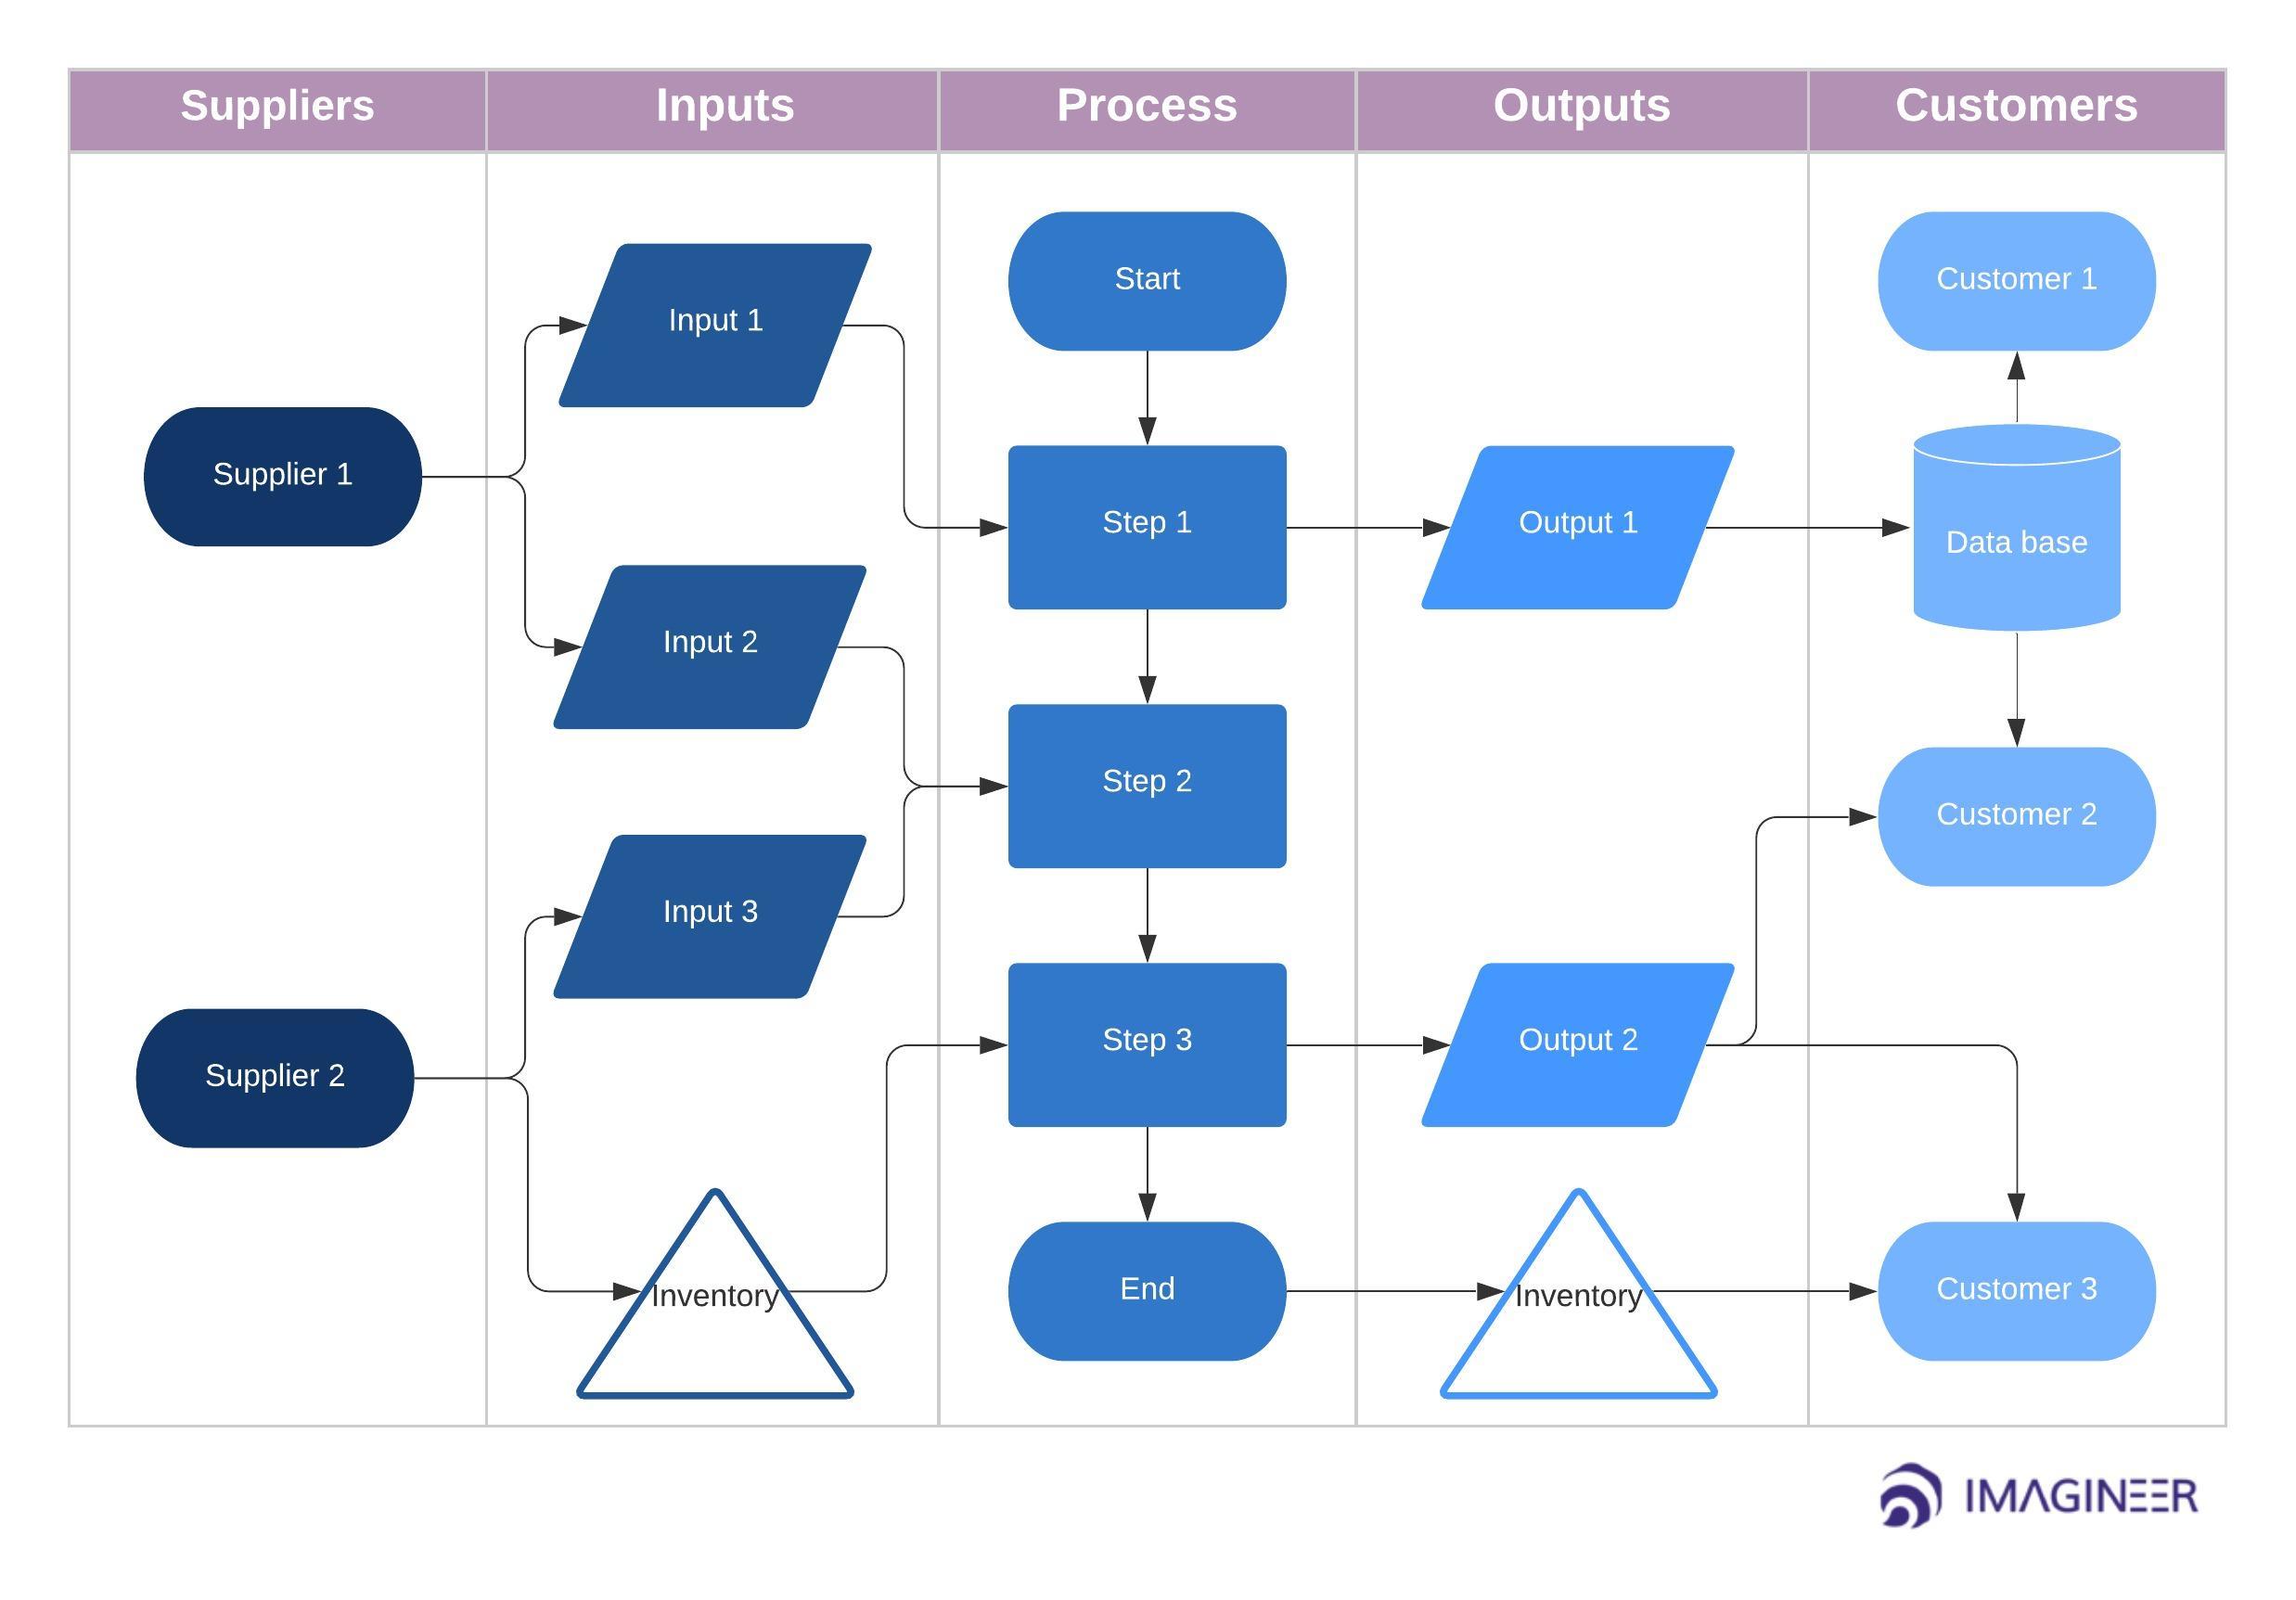
SIPOC is a tool that allows simply visualizing the process, establishing the main variables that affect it. Its acronym reflects these constants: Suppliers - Inputs - Process - Outputs - Customers.
Suppliers (S): will be the people or organizations that provide resources of any kind to your business.
Inputs (I): can be raw materials, information, supplies, or data.
Process (P): those activities that transform the inputs.
Outputs (O): the result of the process, that product or service intended for the customer.
Customers (C): refers to the people or organizations that receive the outputs; these can be internal customers, such as a department within the same company or external.
You can design this tool in a table format, like the one you will find at the end of the blog if you want to download and get the template, or in a flowchart format, like the next one.
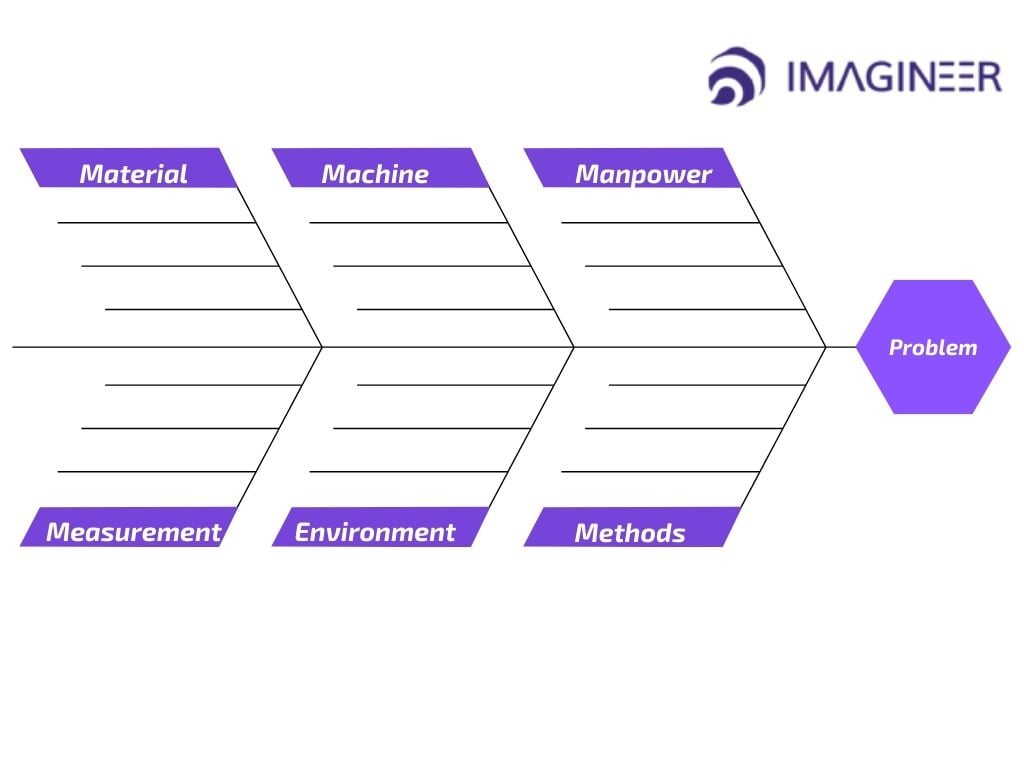
Also called "Fishbone Diagram" or "Cause/Effect Diagram," it is a tool used for the analysis of the main causes that originate a problem; therefore, it is perfect for the DMAIC analysis phase. The variables it considers are the following:
- Workforce
- Material
- Method
- Measurement
- Machines
- Environment
For the analysis, you must focus all ideas on the process under study and identify possible causes for the problem according to each approach. For example, a pizzeria wants to reduce home delivery times since there have been complaints about delays, so they decide to apply the Ishikawa Diagram. The team identifies that one of the causes could be the motorcycle, it is a bit old and sometimes gives problems on the road, i.e., it could be a machine problem. Also, the traffic is hefty, and the streets are not in good condition so the cause could be the environment. Also, the delivery man just got his driver's license, the method is not the best since he is not that experienced and besides, he is new to the area, so he does not know the best routes.
As you can see, there can be many causes for a single problem, which is why this tool is so helpful for analyzing all the possibilities. Of course, once you have identified the root causes, you must determine which ones are most important or have the most weight for improvement.
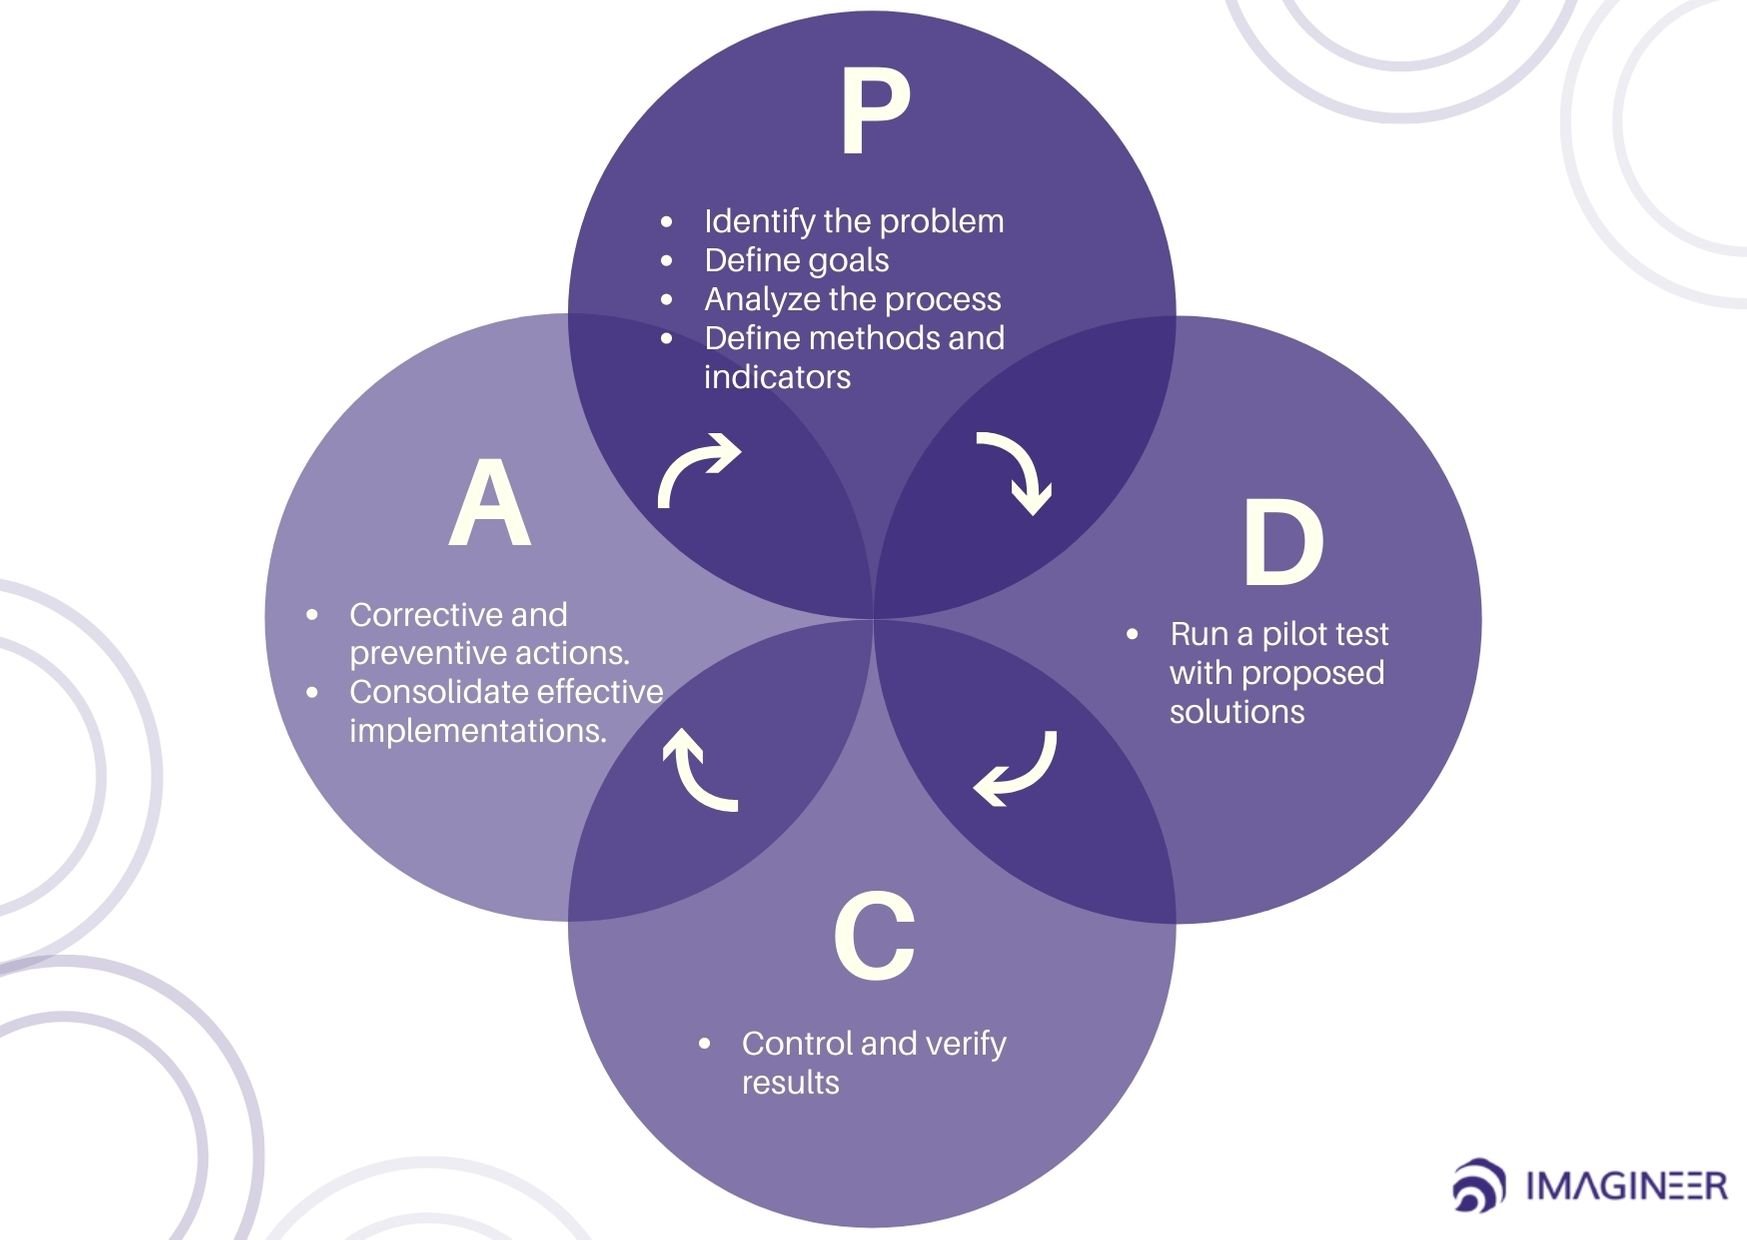
The PDCA Cycle, also called the "Deming Cycle," is one of the most used tools in continuous improvement projects. This methodology follows a logic similar to DMAIC; its acronym represents the steps to follow systematically to achieve a continuous improvement cycle: Plan - Do - Check - Act.
Being a continuous improvement tool, its four stages are cyclical, i.e., you identify the process to be improved, establish the objective, define the work team and brainstorm to find possible solutions; this is the planning stage. Then you go to "do," you can first do a pilot test of the proposed solutions and then jump to implement the best idea to enter the verification stage. The implementation is in a testing period; you must control and verify its performance. Finally, you must act, depending on whether the solution must be implemented definitively or if, in the verification stage, there were problems that must be reviewed and corrected; if not, the idea must be discarded entirely. But, the truth is that you have not reached the end because once you have gone through the four phases, you must go back to the beginning and repeat the cycle, constantly reevaluating the process to find improvements.

If your goal is to improve a process, the first thing you must do is understand it. To do this, you need to get the information, define the step by...

“Life is a process”.If you think about it, it doesn't take too much philosophizing to realize that this is so. Life is a process.

A value stream map (VSM) is a powerful tool used in continuous improvement methodologies such as Lean and Six Sigma to visualize and analyze the flow...
