
What is Tableau and what is it used for?
Did you know that Tableau is popular in many large companies? Knowing how to use such tools is truly important nowadays in the world of data.
2 min read
The term “big data” is used to describe large amount of data which can be either structured (information commonly found in most databases that are often displayed in rows and columns with titles) or unstructured (emails, videos, audios, spreadsheets and others).
Ironically, when we talk about big data what matters is not how big the data is but what companies do with the data. It can be analyzed to gather information that leads to better business decisions and strategic movements.
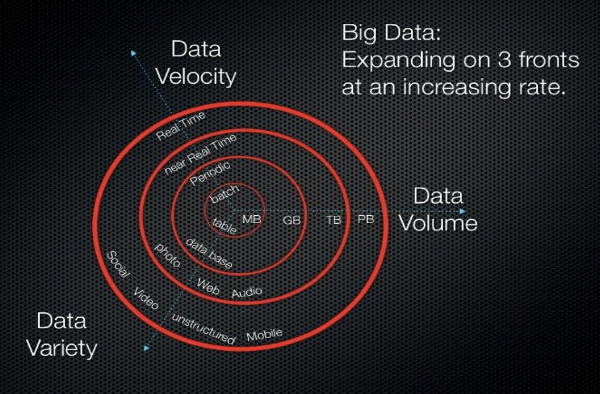
When we talk about big data, it is useful to turn to Gartner analyst Doug Laney, who, in a 2001 MetaGroup research post, "3D Data Management: Data Volume Control, variety and speed" introduced the concept of the 3Vs. 3Vs mean volume, variety, and velocity, the three big data properties. The volume refers to the amount of data, the variety refers to the number of data types and the speed refers to the speed of data processing. According to the 3V model, the challenges of big data management involve the expansion of the three properties, rather than just the volume.
It has recently been proposed that additional Vs are added to the model, including variability (the increase in the typical value range of a large data set) and value, which addresses the need to valuate business data. The following infographic published by Diya Soubra, "The 3V Slams That Define Big Data, in Data Science Central" illustrates the growing expansion of 3Vs.
>> Why is Big Data important to businesses? <<
The goal of Big Data is to create value in the ability to analyze large volumes of data, view massive information that is often "asleep" on its servers, and analyze patterns that can help you gain competitive when it comes to decision making. The main objective is, therefore, to "ask the data" in such a way that they can help you understand what is happening, why its happening, and that “x” thing may also happen. These variables are what are known as descriptive, prescriptive and predictive analysis:
Descriptive Analytics: Descriptive analytics uses historical data, identifying behaviors and describing how things are being done. It is the most used analytics in companies and its objective is to describe the current situation in order to make decisions with a high degree of success. This type of analysis looks at different business indicators in order to get a glimpse of what has happened and is happening.
Prescriptive Analytics: Prescriptive analytics use simulation and optimization techniques, indicating which path your company should really be taking, providing information about what can be done in order to improve and providing recommendations to maximize business indicators. This is the most advanced type of analysis and in which no longer only predicts what will happen, but prescribes an adequate solution through business rules that execute processes to react to a given indicator.
Predictive Analytics: Predictive analytics make it possible to create models that allow us to forecast what will happen. This kind of analysis helps the company understand how it’s environment can be changed both internally and externally. For example, in this kind of analysis you could determine how many sales your business will make in the next month based on the current year's pattern of behavior. Its purpose is to make forecasts based on advanced mathematical methods such as statistics or machine learning to predict missing data.
The most common question in this type of analysis: What will happen? Does your business know?

Did you know that Tableau is popular in many large companies? Knowing how to use such tools is truly important nowadays in the world of data.

You have probably heard many times the name of this famous canvas to analyse your value proposition from the customer's point of view. Still, you ask...

Considered one of the leading software by prestigious analysts such as Gartner and Forrester, Marketo aims to provide businesses of all types and...
