

What is Big Data and What is it For?
The term “big data” is used to describe large amount of data which can be either structured (information commonly found in most databases that are...
3 min read
Did you know that Tableau is popular in many large companies? Knowing how to use such tools is truly important nowadays in the world of data.
If you're not familiar with what I'm talking about and have never heard the term Tableau, let me tell you that you're missing out on a very powerful tool. In this article, I'll briefly discuss the features of this software and why it can bring significant benefits to business strategies.
What is Tableau?
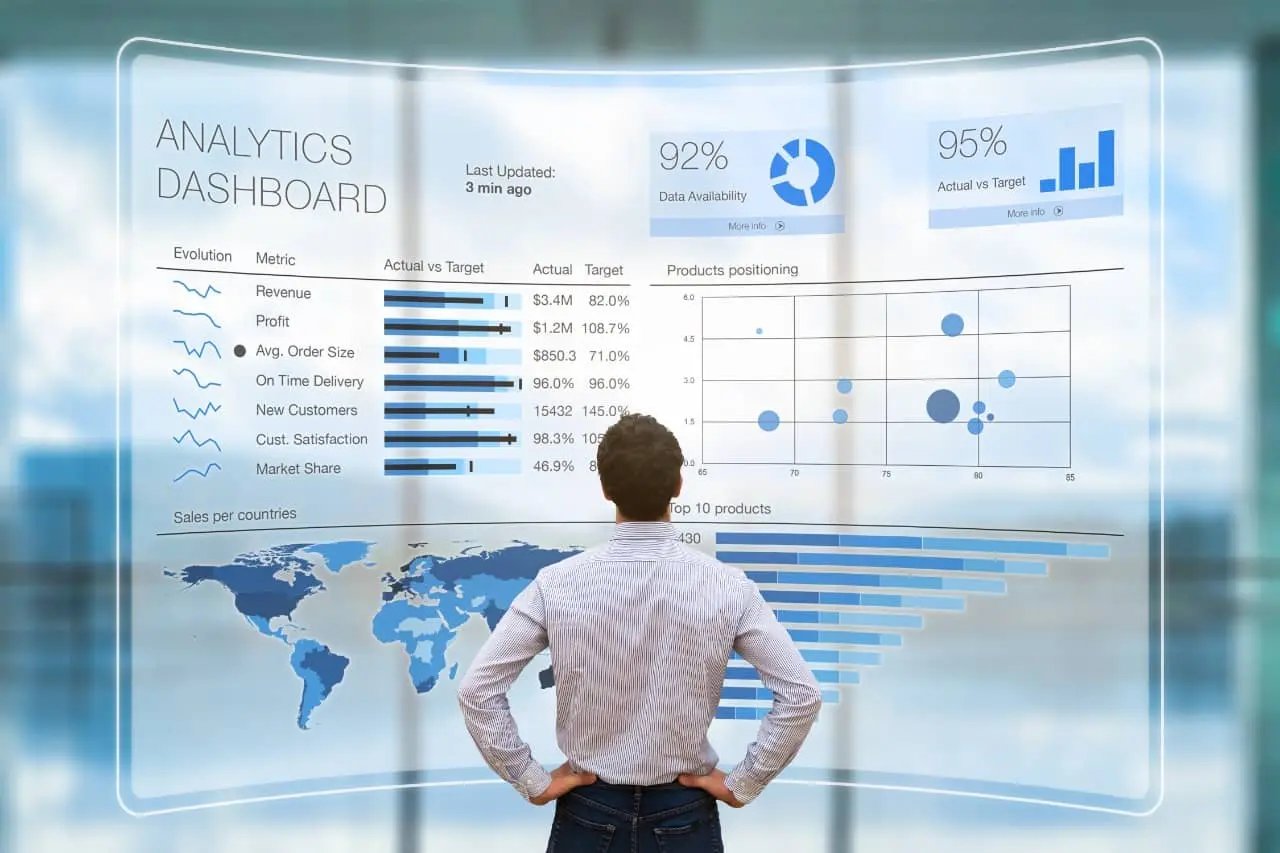
Tableau is a data analysis and business intelligence tool. Essentially, it's a way to understand data through visualizations and various types of analysis to make informed decisions.
On its official website, Tableau is defined as: "a visual analytics platform transforming the way we use data to solve problems. It enables people and organizations to get the most value out of their data."
It is software capable of processing data sources to represent them in measurable visualizations that can be shared with our team and clients to make better decisions. This is commonly known as a business intelligence tool.
Business Intelligence
Business Intelligence (BI) combines business analysis, data mining, data visualization, tools and data infrastructure, and best practices to help organizations make more data-driven decisions.
In practice, you know you have a modern business intelligence system when you have a comprehensive view of your organization's data and use it to drive change, eliminate inefficiencies, and quickly adapt to market or supply changes.
Why is data visualization important?
The answer is quite simple. Data visualization is important because humans understand things that are visually descriptive. Therefore, working with data visualization tools will aid in better and easier understanding. Additionally, well-designed charts and graphics are often the simplest and most powerful way to present any data.
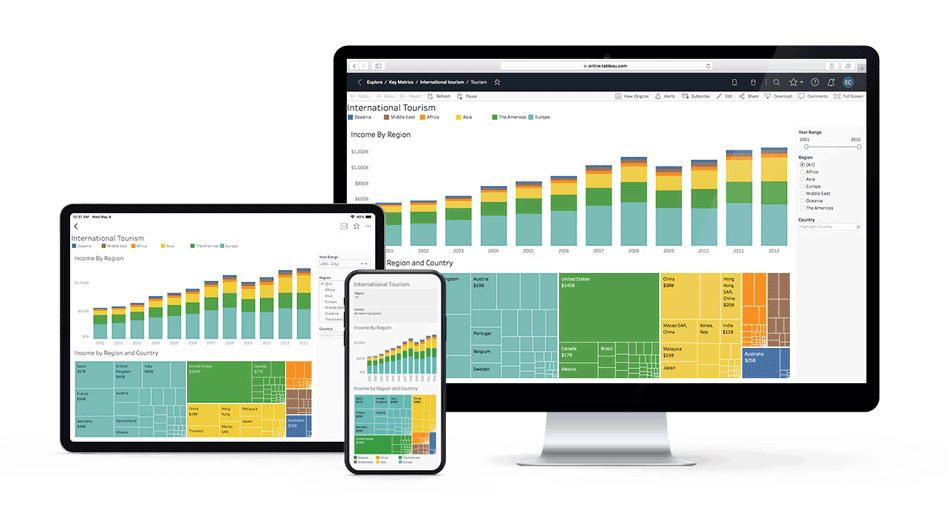
Tableau is available in different versions for specific business process purposes. Among its main products are:
1. Tableau Desktop: This is the most popular version and is typically taught in courses or training. It is the primary tool of Tableau where analysis takes place, visualizations are created, and dashboards are developed.
2. Tableau Prep: This component helps filter information and is used to clean the data you receive for better workability. It allows you to reduce time spent on data cleaning through available automations.
3. Tableau Cloud: This is the cloud component where you can store all your work online. It allows you to save the data you collect in the cloud, along with the dashboards and visualizations created from that data.
4. Tableau Server: This is where companies upload all their private data and files. It enables sharing, collaboration with colleagues, data management, whether in physical installations or in the cloud. Larger enterprises typically require Tableau Server.
5. Tableau Public: This is a completely free version that has most of the functionalities of Tableau. The key difference is that the data is public. If you want to learn how to use Tableau, this version is recommended. However, if you are a company with private data that you do not want to share, you would need to use a licensed version.
When using Tableau, you need to connect to a data source so that Tableau can draw information from it. You can choose from spreadsheets, PDFs, text documents, database servers, or other management software used in your company.
Once the data sources are connected, you have a blank canvas to build your masterpiece. You can start visualizing; in each Tableau worksheet, data is divided into dimensions on the left, integrating categories such as customers, dates, products, or countries. In the main area of the screen, you will find an analysis section with columns and rows. You simply drag a category and a type of measure into them to create a chart.
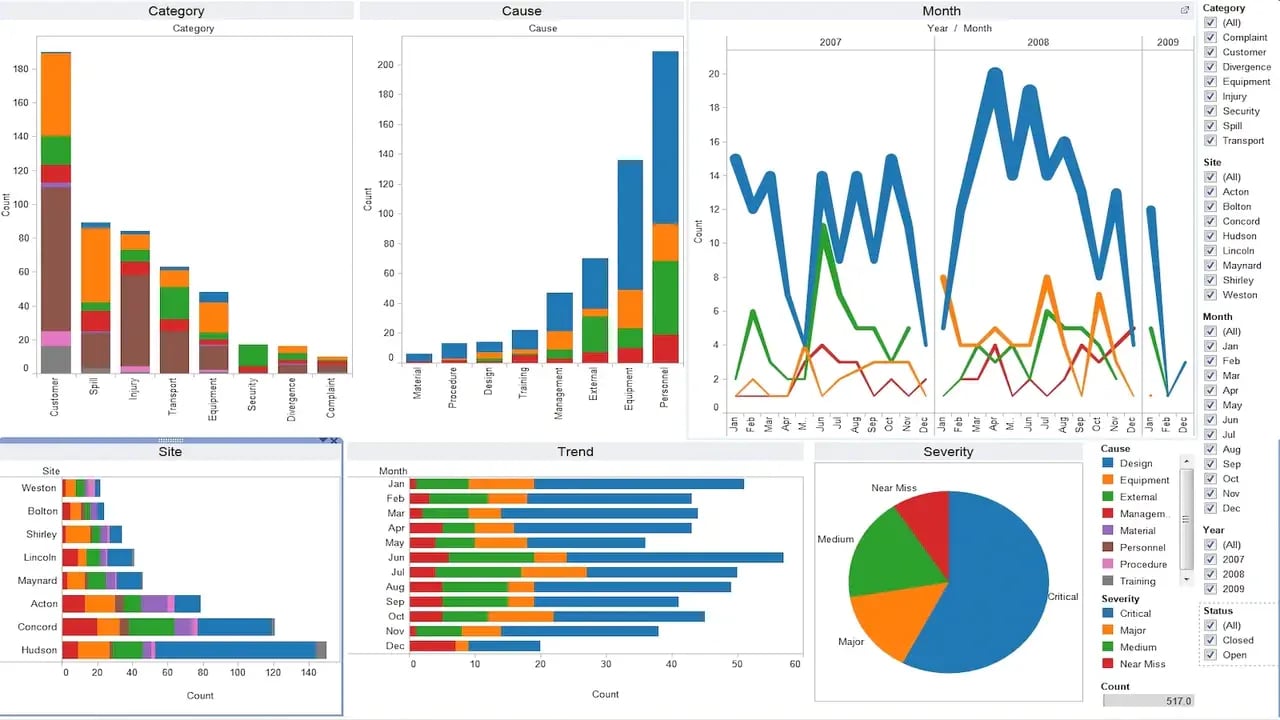
You can add as many rows and columns as needed and rearrange them to facilitate analysis. Additionally, you have the flexibility to choose the chart layout that best presents the information. Once you have created multiple sheets with different visualizations, you can build dashboards that group a set of these views for comprehensive data analysis. When you're ready to share your work, you can publish it within your corporate intranet for your managers and colleagues to view.
Tableau allows you to create more than 24 different charts to display your data, but its true power lies in the customization of these visuals. You can craft stunning infographics, build functions to analyze your data, and leverage a robust suite of analytical features.
Furthermore, Tableau boasts a highly active online community that openly shares their visualizations. This community provides a wealth of inspiration for creating your next informative masterpiece, akin to a Picasso of data.


The term “big data” is used to describe large amount of data which can be either structured (information commonly found in most databases that are...

In the exciting world of technology, the term "Tech Stack" has become a fundamental element in software development. But, what does it really mean?...

Find out what HubSpot playbooks are, how to use them and why they are indispensable guides for your company sales teams.
