

Step-by-step guide how to create and use Private Apps in HubSpot
Did you know that you can use the HubSpot API to access very specific data in your account in a secure way? You can do this with HubSpot's Private...
4 min read
In the fast-paced world of data analytics, having tools that simplify the understanding and presentation of information is essential. In this context, Tableau emerges as a beacon, enabling users of all levels to transform complex data into intuitive and meaningful visualizations. Whether you find yourself at the crossroads of making the most out of Tableau or simply looking to enhance your skills on this platform, this guide will provide you with a clear and practical path.
Table of Contents

Tableau is a data visualization tool that facilitates the creation of interactive charts, dashboards, and scorecards. With its intuitive interface and the ability to connect to various data sources, Tableau has gained popularity in sectors ranging from business and finance to healthcare and education. Its power lies in the ability to turn raw data into accessible and easily understandable information.

Tableau, with its ability to effectively visualize data, has become a valuable tool, and the following are some of its applications:
>> 3 Key Tools to Achieve a Healthy Digital Transformation <<
1. Sales and Product Performance Analysis:
Tableau allows online retailers to analyze sales and product performance in detail. You can create interactive dashboards that display sales trends, product performance comparisons, and customer segmentation.
2. Customer Experience Tracking:
Visualizing data related to customer experience is crucial in eCommerce. With Tableau, you can analyze user navigation, conversion rates, feedback, and other key indicators to understand and improve the customer experience.
3. Marketing Channel Analysis:
Tableau facilitates tracking and visualizing the performance of different marketing channels, such as social media, email campaigns, and online advertising. You can evaluate the effectiveness of your marketing strategies and allocate resources more efficiently.
4. Inventory and Stock Management:
For eCommerce businesses, managing inventory is crucial. Tableau helps analyze inventory levels, forecast demand, and optimize the supply chain. Clear visualizations can facilitate decision-making to avoid losses due to excess or insufficient inventory.
5. Profitability Monitoring:
Profitability analysis is fundamental in eCommerce. With Tableau, you can create dashboards that display costs associated with each product, profit margins, and the overall profitability of the store. This is essential for strategic decision-making.
6. Shopping Cart Abandonment Analysis:
Shopping cart abandonment is common in eCommerce, but understanding the reasons behind it can be crucial. Tableau can help analyze abandonment patterns, identify problematic points in the purchase process, and take corrective actions.
7. Customer Personalization and Segmentation:
Tableau makes it easy to create customer segments based on purchasing behaviors, preferences, and other relevant data. These segments can be used to personalize the customer experience and design more effective marketing strategies.
Steps to Implement Tableau
Step 1: Download and Install Tableau
The first step in implementing Tableau is to download and install the software. Visit the official Tableau website, select the version that best suits your needs, and follow the installation instructions.
Step 2: Connect to Your Data
Once Tableau is installed, the next step is to connect to your data. Tableau supports a wide range of data sources, such as spreadsheets, SQL databases, text files, and more. Let's look at a practical example using an Excel file:
1. Open Tableau and select "Connect to Data."
2. Choose the "Excel" option and select your file.
3. Tableau will automatically import the data and display it in the interface.
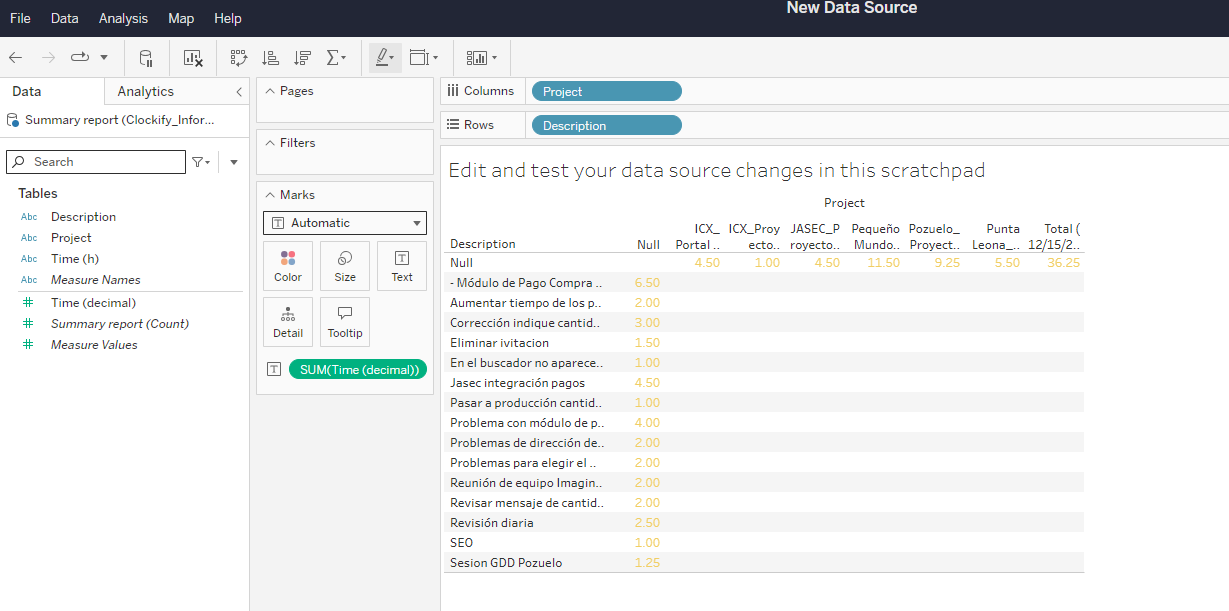
Step 3: Create Basic Visualizations
Now that you have connected your data, it's time to create basic visualizations. Let's say you have sales data and want to create a bar chart to represent monthly revenue. Here's a practical example:
1. Select the appropriate dimensions and measures.
2. Drag the "Month" dimension to the columns shelf and the "Revenue" measure to the rows shelf.
3. Tableau will automatically generate a bar chart displaying monthly revenue.
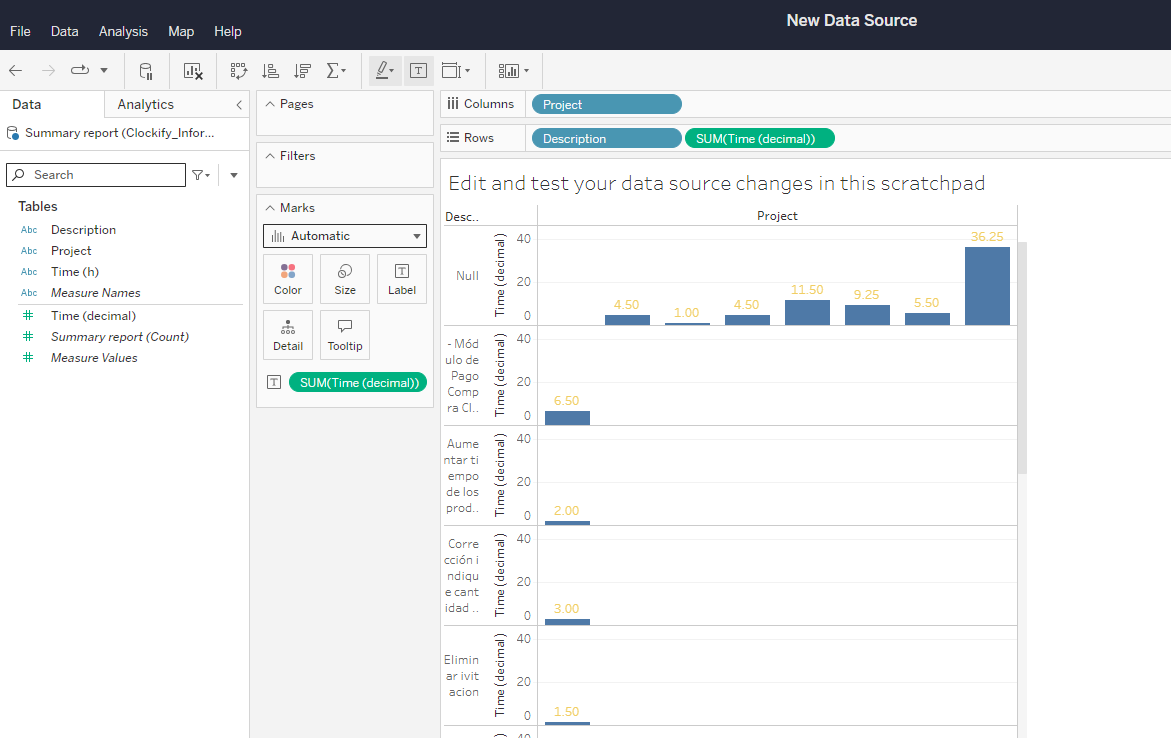
Step 4: Create Interactive Dashboards
Tableau excels when it comes to interactivity. Let's add interactivity to our bar chart:
1. Drag the "Product" dimension to the color shelf.
2. Now, as you hover over the bars, you'll be able to see revenue breakdowns by product.
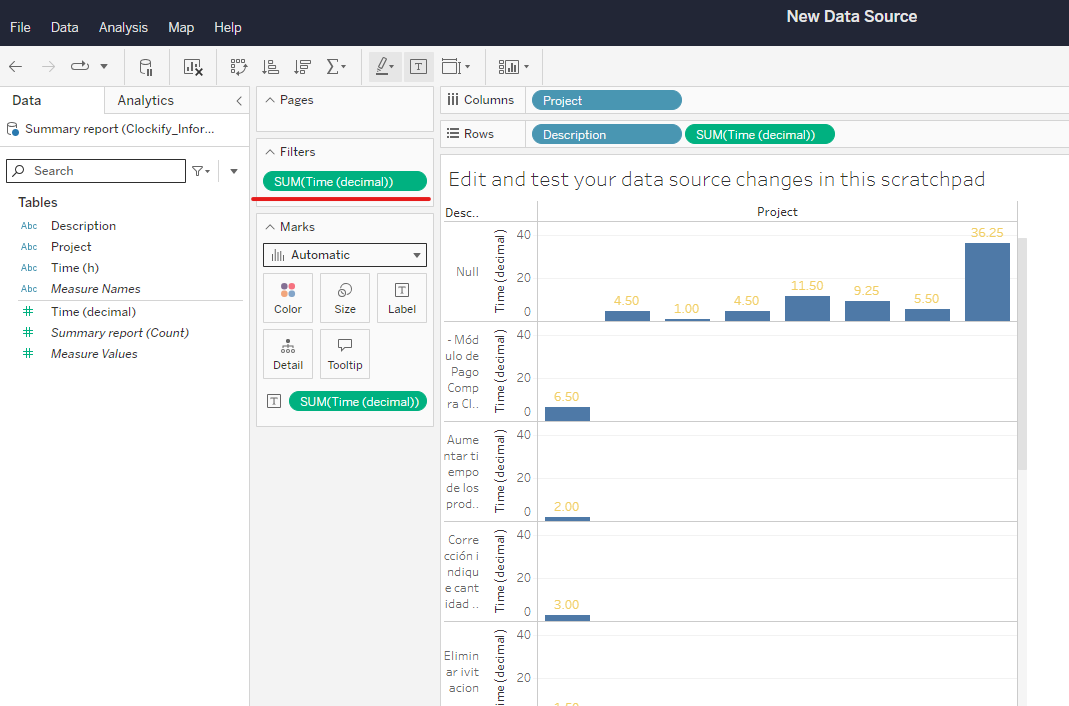
Step 5: Build a Dashboard
Dashboards allow users to interact with various elements of the visualization. Suppose you want to add a date filter:
1. Drag the "Date" dimension to the filter shelf.
2. Select the desired date range.
3. Now, you can dynamically change the time period you are visualizing.
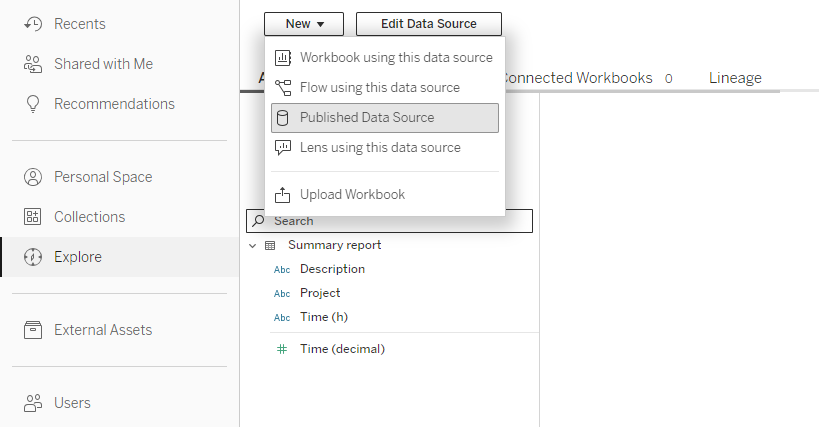
Step 6: Publish to Tableau Server or Tableau Online
Once you've created your visualizations, it's time to share them. You can publish your dashboards to Tableau Server or Tableau Online for others to access. Here's a practical example:
1. Click on "File" and select "Publish to Tableau Server/Online."
2. Enter your credentials and follow the steps to publish your work.
Step 7: Schedule Automatic Updates
Keep your visualizations always up-to-date by scheduling automatic updates. Suppose your data is updated monthly:
1. Connect to the data source and select "Refresh Now."
2. Set up a schedule for monthly automatic updates.
>> Step-by-step Guide for Ticket Implementation <<
Integrating Tableau with eCommerce (Magento)
In case you need to integrate eCommerce with Tableau, follow these steps for Magento:
Step 1: Prerequisites
Ensure you have access to your Magento store with administrator credentials.
Step 2: Enable REST API in Magento
1. Access the Magento admin panel.
2. Go to Stores -> Settings -> Configuration.
3. In the Services -> Magento Web API section, enable the "Enable Token" option.
4. Save the configuration.
Step 3: Create an API User
1. Go to System -> Extensions -> Integrations.
2. Create a new integration, provide a name, and configure necessary permissions.
3. After saving, generate and copy the Access Token.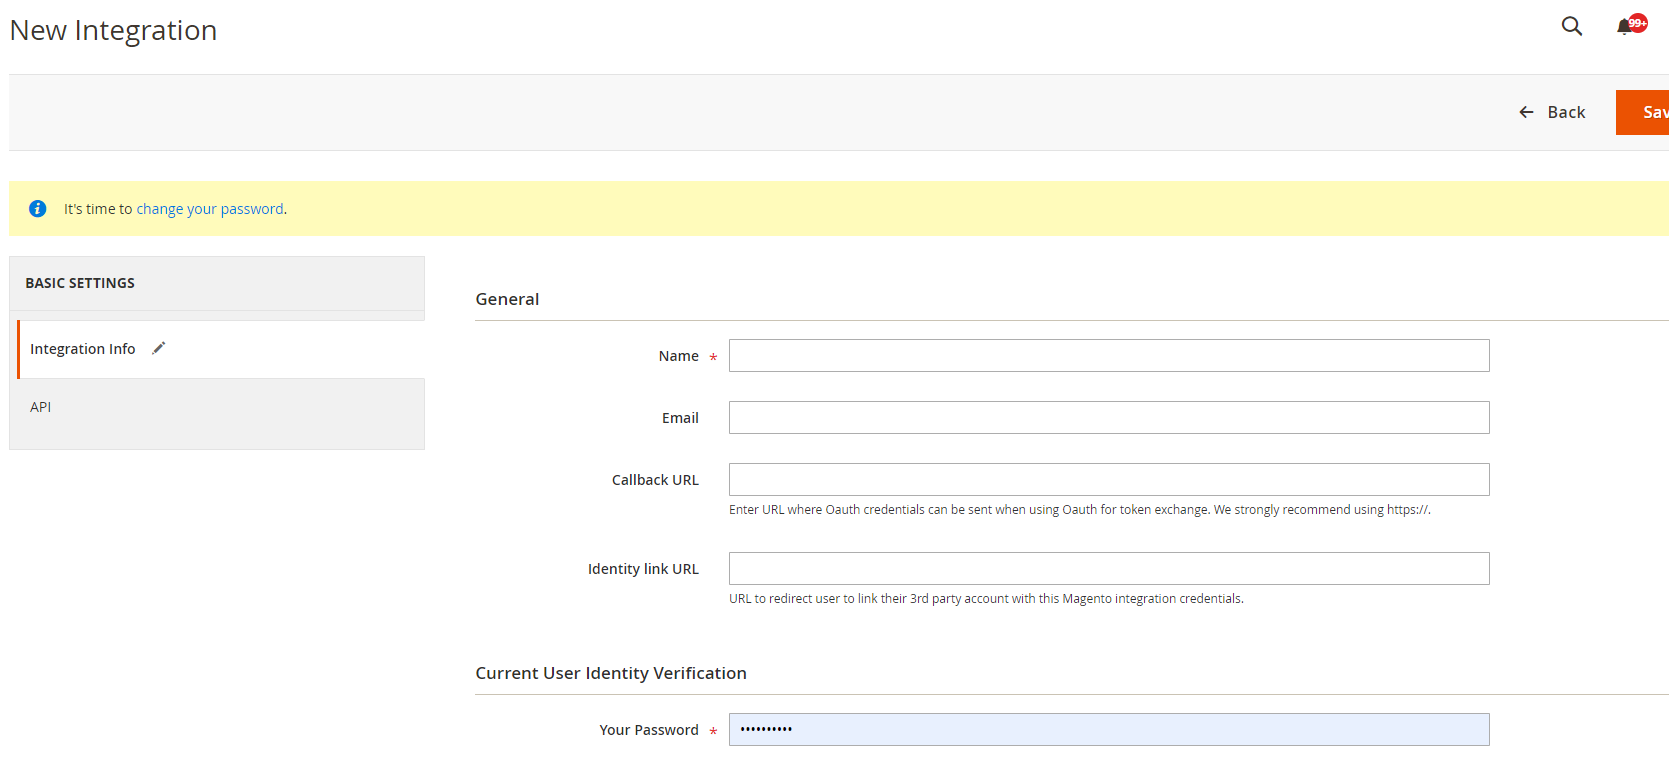
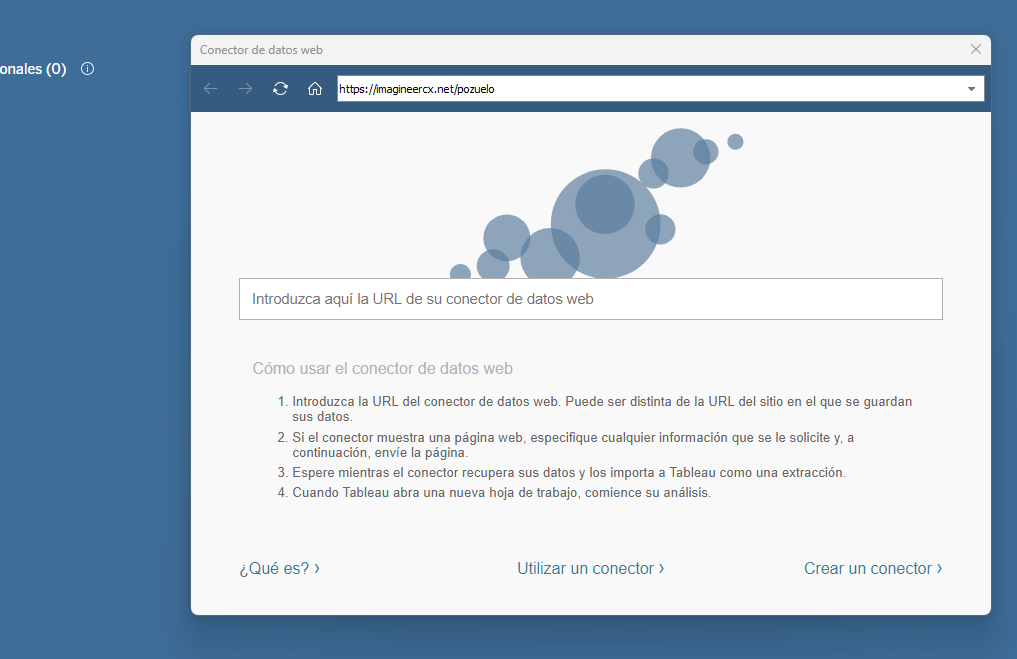
Step 4: Connect Tableau to Magento:
1. Open Tableau.
2. Select the option "Connect to Data -> Web Data Connector."
3. Enter the URL of the Magento REST API (for example, https://yourstore.com/rest).
4. Provide the Access Token you generated.
Step 5: Map Fields and Configure the Connection:
Tableau will attempt to access the data available at the provided URL. Map the necessary fields, such as products, orders, customers, etc.
Configure additional settings according to your needs, such as data refresh frequency.
Step 6: Create Visualizations:
Once Tableau is connected to Magento, you can start creating visualizations.
Explore data such as sales by category, order tracking, customer analysis, etc.
Implementing Tableau not only enhances data visualization but also transforms the way we understand information. From the initial connection to data to publishing and scheduling updates, each step in this process adds layers of understanding and clarity. As you delve into the world of Tableau, you'll discover its ability to empower individuals and organizations, providing a deeper and more meaningful insight into the vast ocean of data.

Did you know that you can use the HubSpot API to access very specific data in your account in a secure way? You can do this with HubSpot's Private...

Business Model Canvas: What it is and how to create a business model canvas Have you ever felt that it is difficult to communicate and set strategic...
Every Magento instance consits of at least two seperate sites: the frontend, which allows customers to navigate, create accounts and purchase goods,...
